Brokers
Turn your Groww order history into a trading journal you can actually learn from.
Groww gives you trades. Arthveda gives you insights and analytics. See how you can turn your Groww Stock Order History into a journal with performance analytics, insights that tell you where and why you lose or make money, and a trade-level feedback loop in less than five minutes.
A P&L statement is what your accountant needs. A journal is what you need to get better.
- Cash · stocks, etfs
- F&O · index, stocks, commodity · log manually
Not on Groww? See all supported brokers.

See the full trade, not just the execution.
PnL, charges, duration, chart context, executions, notes, and tags, all tied to the same Groww trade.
Everything you get from one Groww import
Your Groww trades become a dashboard, insights, reports, and a searchable journal, with no setup and no formulas to maintain.

Dashboard
Net PnL, win rate, expectancy, and your equity curve over time.
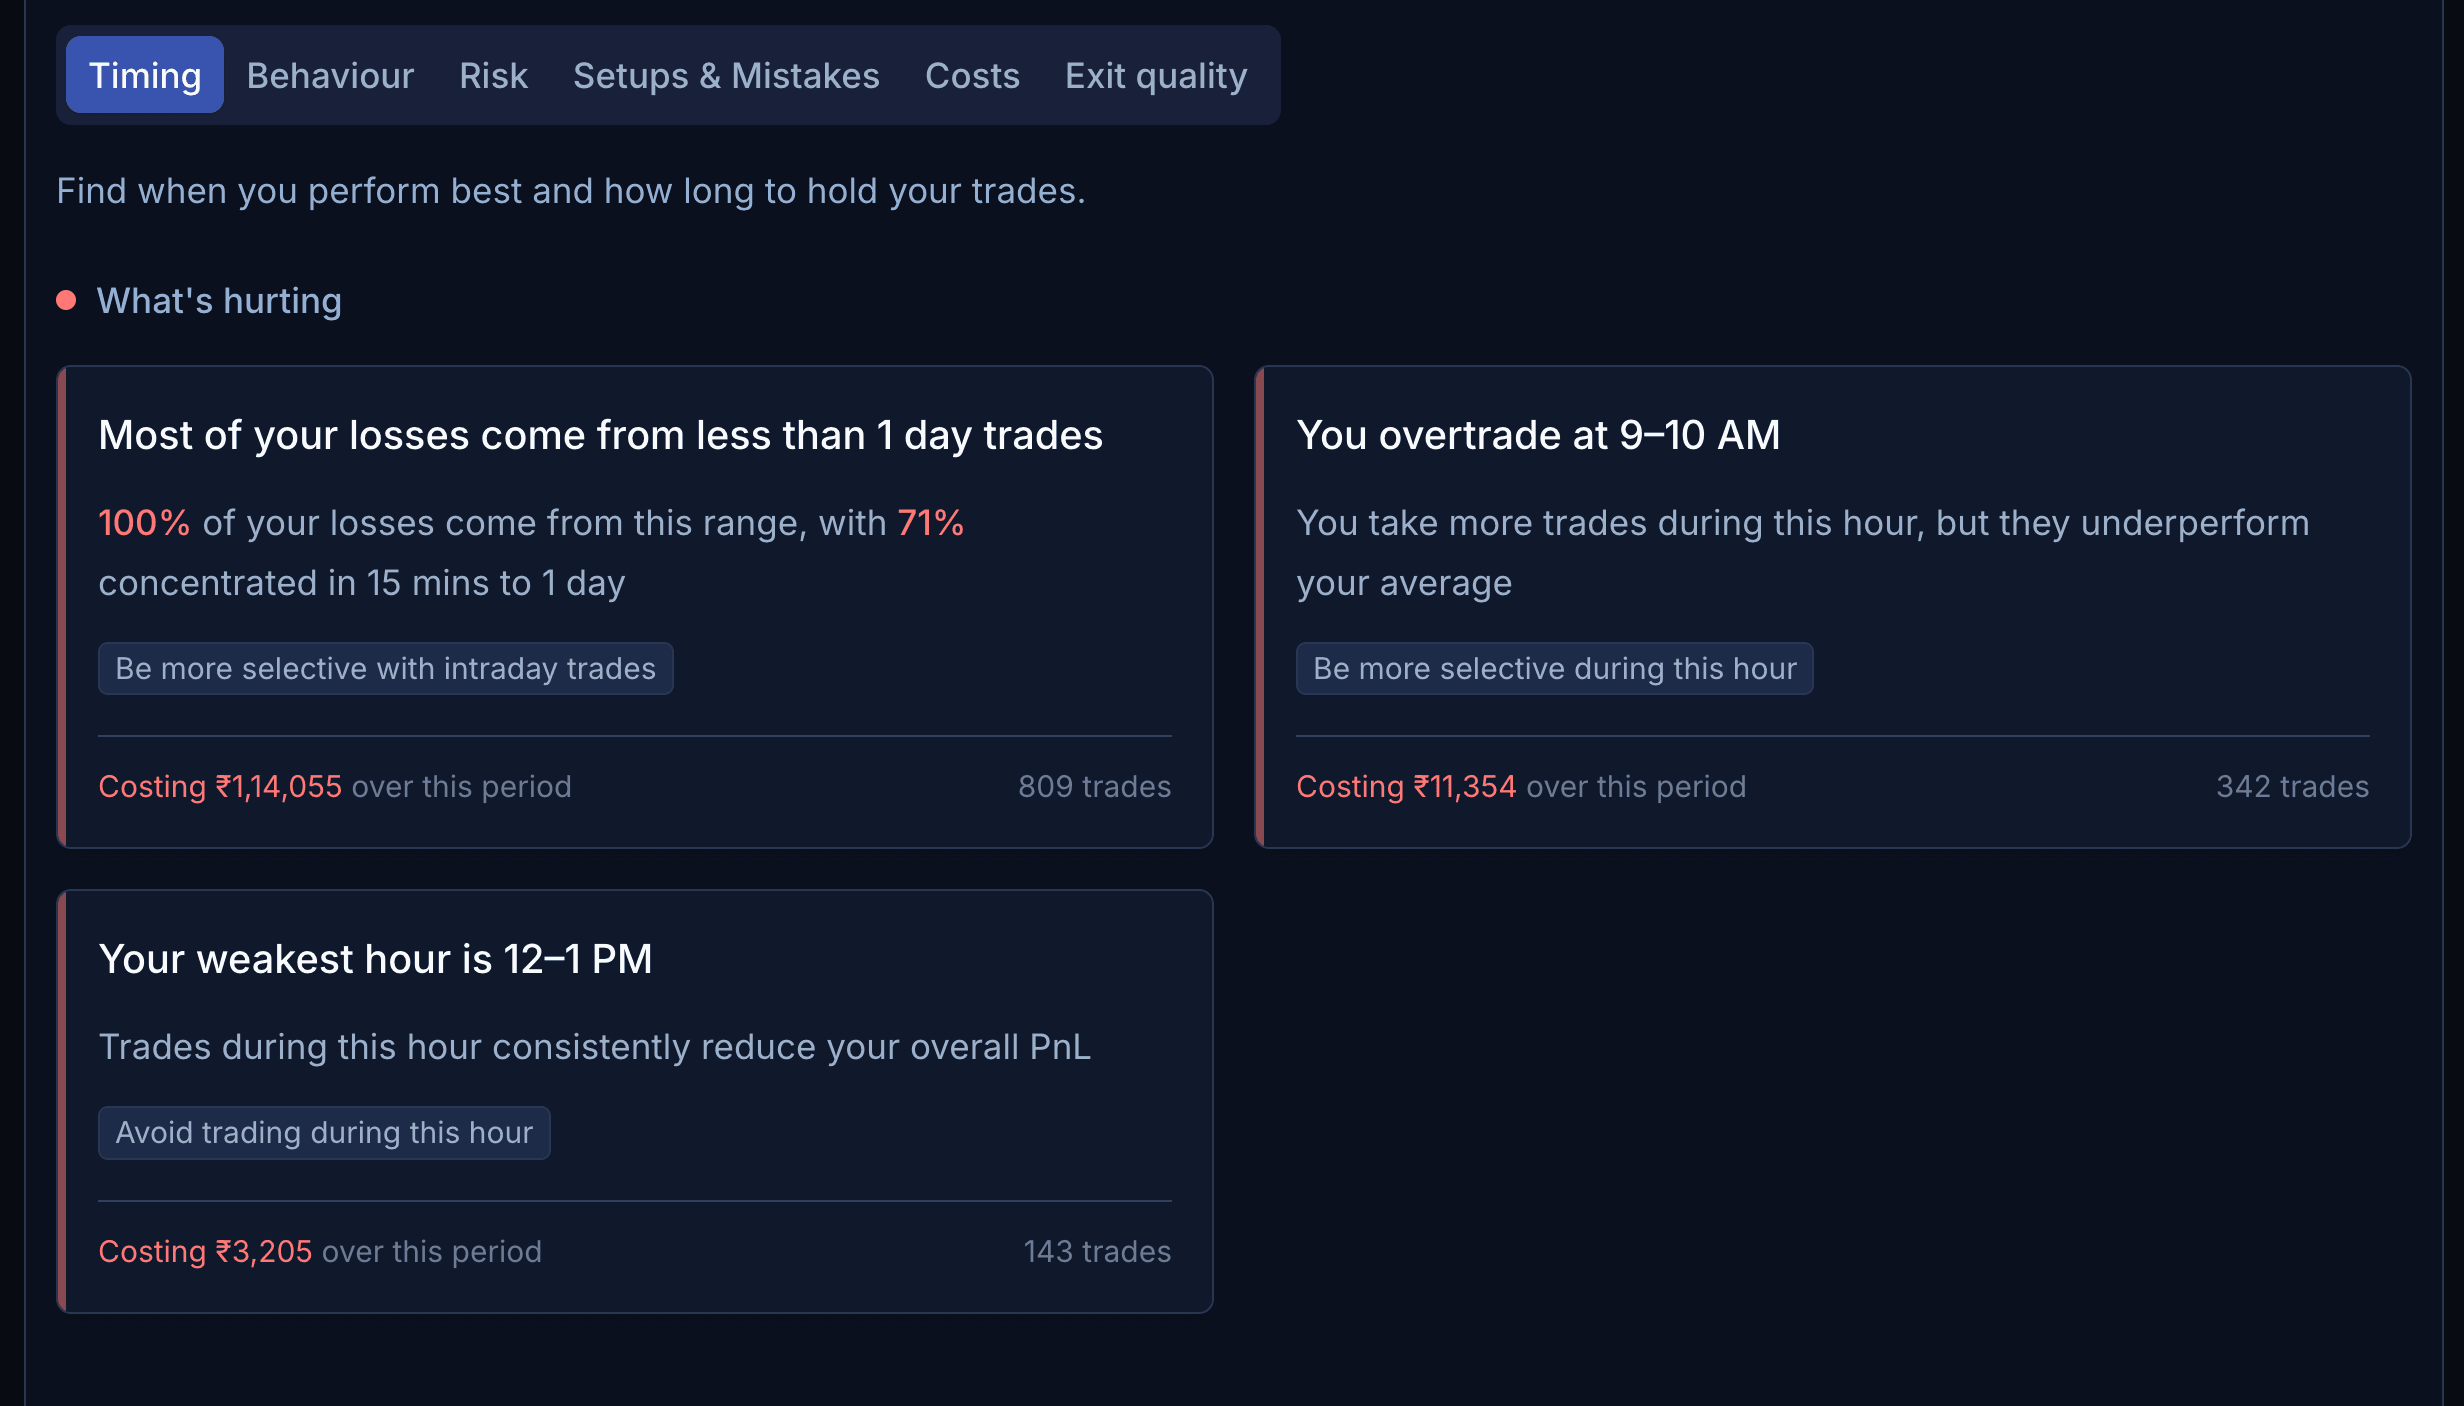
Insights
The patterns behind your wins, losses, timing, and mistakes.

Reports
Performance broken down by symbol, setup, timeframe, and tag.

Trades
Your full history, with filters and a detailed breakdown per trade.

Tagging
Tag by setup, mistake, or market condition, then measure each one.

Notebook
Attach your reasoning and chart screenshots to the actual trade.
Read-only, always. You import a file, so all Arthveda ever sees are the trades inside it, never your funds or anything else in your account.
If you trade on Groww and your history lives in order-history exports, this guide shows how to turn that file into a journal you can actually learn from.
You have a couple of hundred trades sitting in your Groww account. You roughly know last quarter was green. You can't tell which setup delivered most of that PnL, which trades you held too long, or whether your "high conviction" trades actually outperformed your gut-feel ones.
The problem isn't your trading. The problem is that an order history and a journal solve completely different problems.
What Groww actually shows you
Groww shows you your trades and PnL reports, the numbers your accountant needs at tax time. That is genuinely useful, but it is built for filing, not for working out how you actually trade.
The artifact that actually moves your edge is the one most Groww users end up building themselves in Excel, Google Sheets, Notion, or a custom spreadsheet. Usually for two months. Usually it stops.
What Groww's reports are not built for
Pull up your last hundred closed trades in your head and try to answer these:
- What's my win rate over the last quarter?
- What's my average winner versus my average loser, in R-multiples?
- Are my breakout trades more profitable than my mean-reversion trades, or am I just remembering the dopamine ones?
- Do trades I hold overnight outperform my intraday ones after charges?
- Which setup is dragging my overall PnL down, even though it feels good when it works?
None of these are answerable from Groww's reports without exporting your order history, opening Excel, writing formulas, and tagging every trade by hand. Most traders never make it to step three. Arthveda answers them in a few clicks.
How to import your Groww trades
Export your order history from Groww
In the Groww app or on groww.in, open your profile, go to Reports, then under Transactions choose Stock Order History, select your time frame, and download the file (XLSX or CSV).
Create your Groww broker account
Sign up or log in to Arthveda. Follow onboarding and select Groww, or go to /accounts and create a Groww broker account.
Click Import and upload the file
Choose Import on the Groww broker account, upload the Stock Order History file, review the parsed trades, and confirm the import. Arthveda groups your executions into trades automatically: one round trip becomes one trade with entry, scaling, exit, holding period, and after-charges PnL computed for you.
Explore your journal
Open Trades, Dashboard, Insights, and Reports. Then pick your first ten trades, add a tag like breakout, earnings, or support-bounce, and add a one-line note on what you were actually thinking when you entered. That's the work. It compounds from here.
The whole flow is about five minutes the first time. Groww doesn't offer trade sync yet, so when you want to add fresh trades, export a new Stock Order History for the date range since your last import and upload it again. Same five clicks, no spreadsheet.
What to actually journal
If you want the journal to do its job, every trade needs a little human input. The number is small on purpose:
- Setup tag — what kind of trade was it? Keep the set small and reusable (eight to twelve tags is plenty).
- Entry reason — one sentence on the trigger. "50 DMA reclaim with above-average volume" is good. "Looked strong" is not.
- Exit reason — stop hit? target hit? time stop? fear? Be honest about the last one.
- R-multiple (optional, high-value) — risked ₹2,000 and made ₹6,000 is a +3R. Track it and after fifty trades you stop arguing with yourself about whether you're positive expectancy.
You can also attach chart screenshots at entry and exit and a note on what you'd do differently. After a month of consistency you'll see at least one pattern you didn't know existed.
Arthveda is more than a journal
Most trading journals stop after the trade. Arthveda connects the workflow before and after it: discovery, watchlists, symbol research, execution, journaling, review, and your public trading record.
The same stock you discovered in a screener can later appear in your watchlist, trade journal, review reports, and symbol history, all connected in one workflow.
Screeners — scan NSE and BSE stocks using price, volume, technical, and candlestick filters. Arthveda remembers the source of every idea, so if a screened stock becomes a trade, you can later see which screeners are actually leading to better results.
Watchlists and symbol pages — track the stocks you care about before and after you trade them, so your research and journal are part of the same workflow.
Public profile — build a public trading identity around your process, not just PnL. Publish selected screeners, watchlists, notes, and trade reviews so others can understand how you find ideas, track them, and learn from them over time.
Frequently asked
Try it free for 14 days. No card required.
The whole product, no limits, for 14 days. Then ₹2,499/yr or ₹4,999 once. All prices include GST.
14-day refund on both plans. If you stop subscribing, your journal stays readable and exportable.