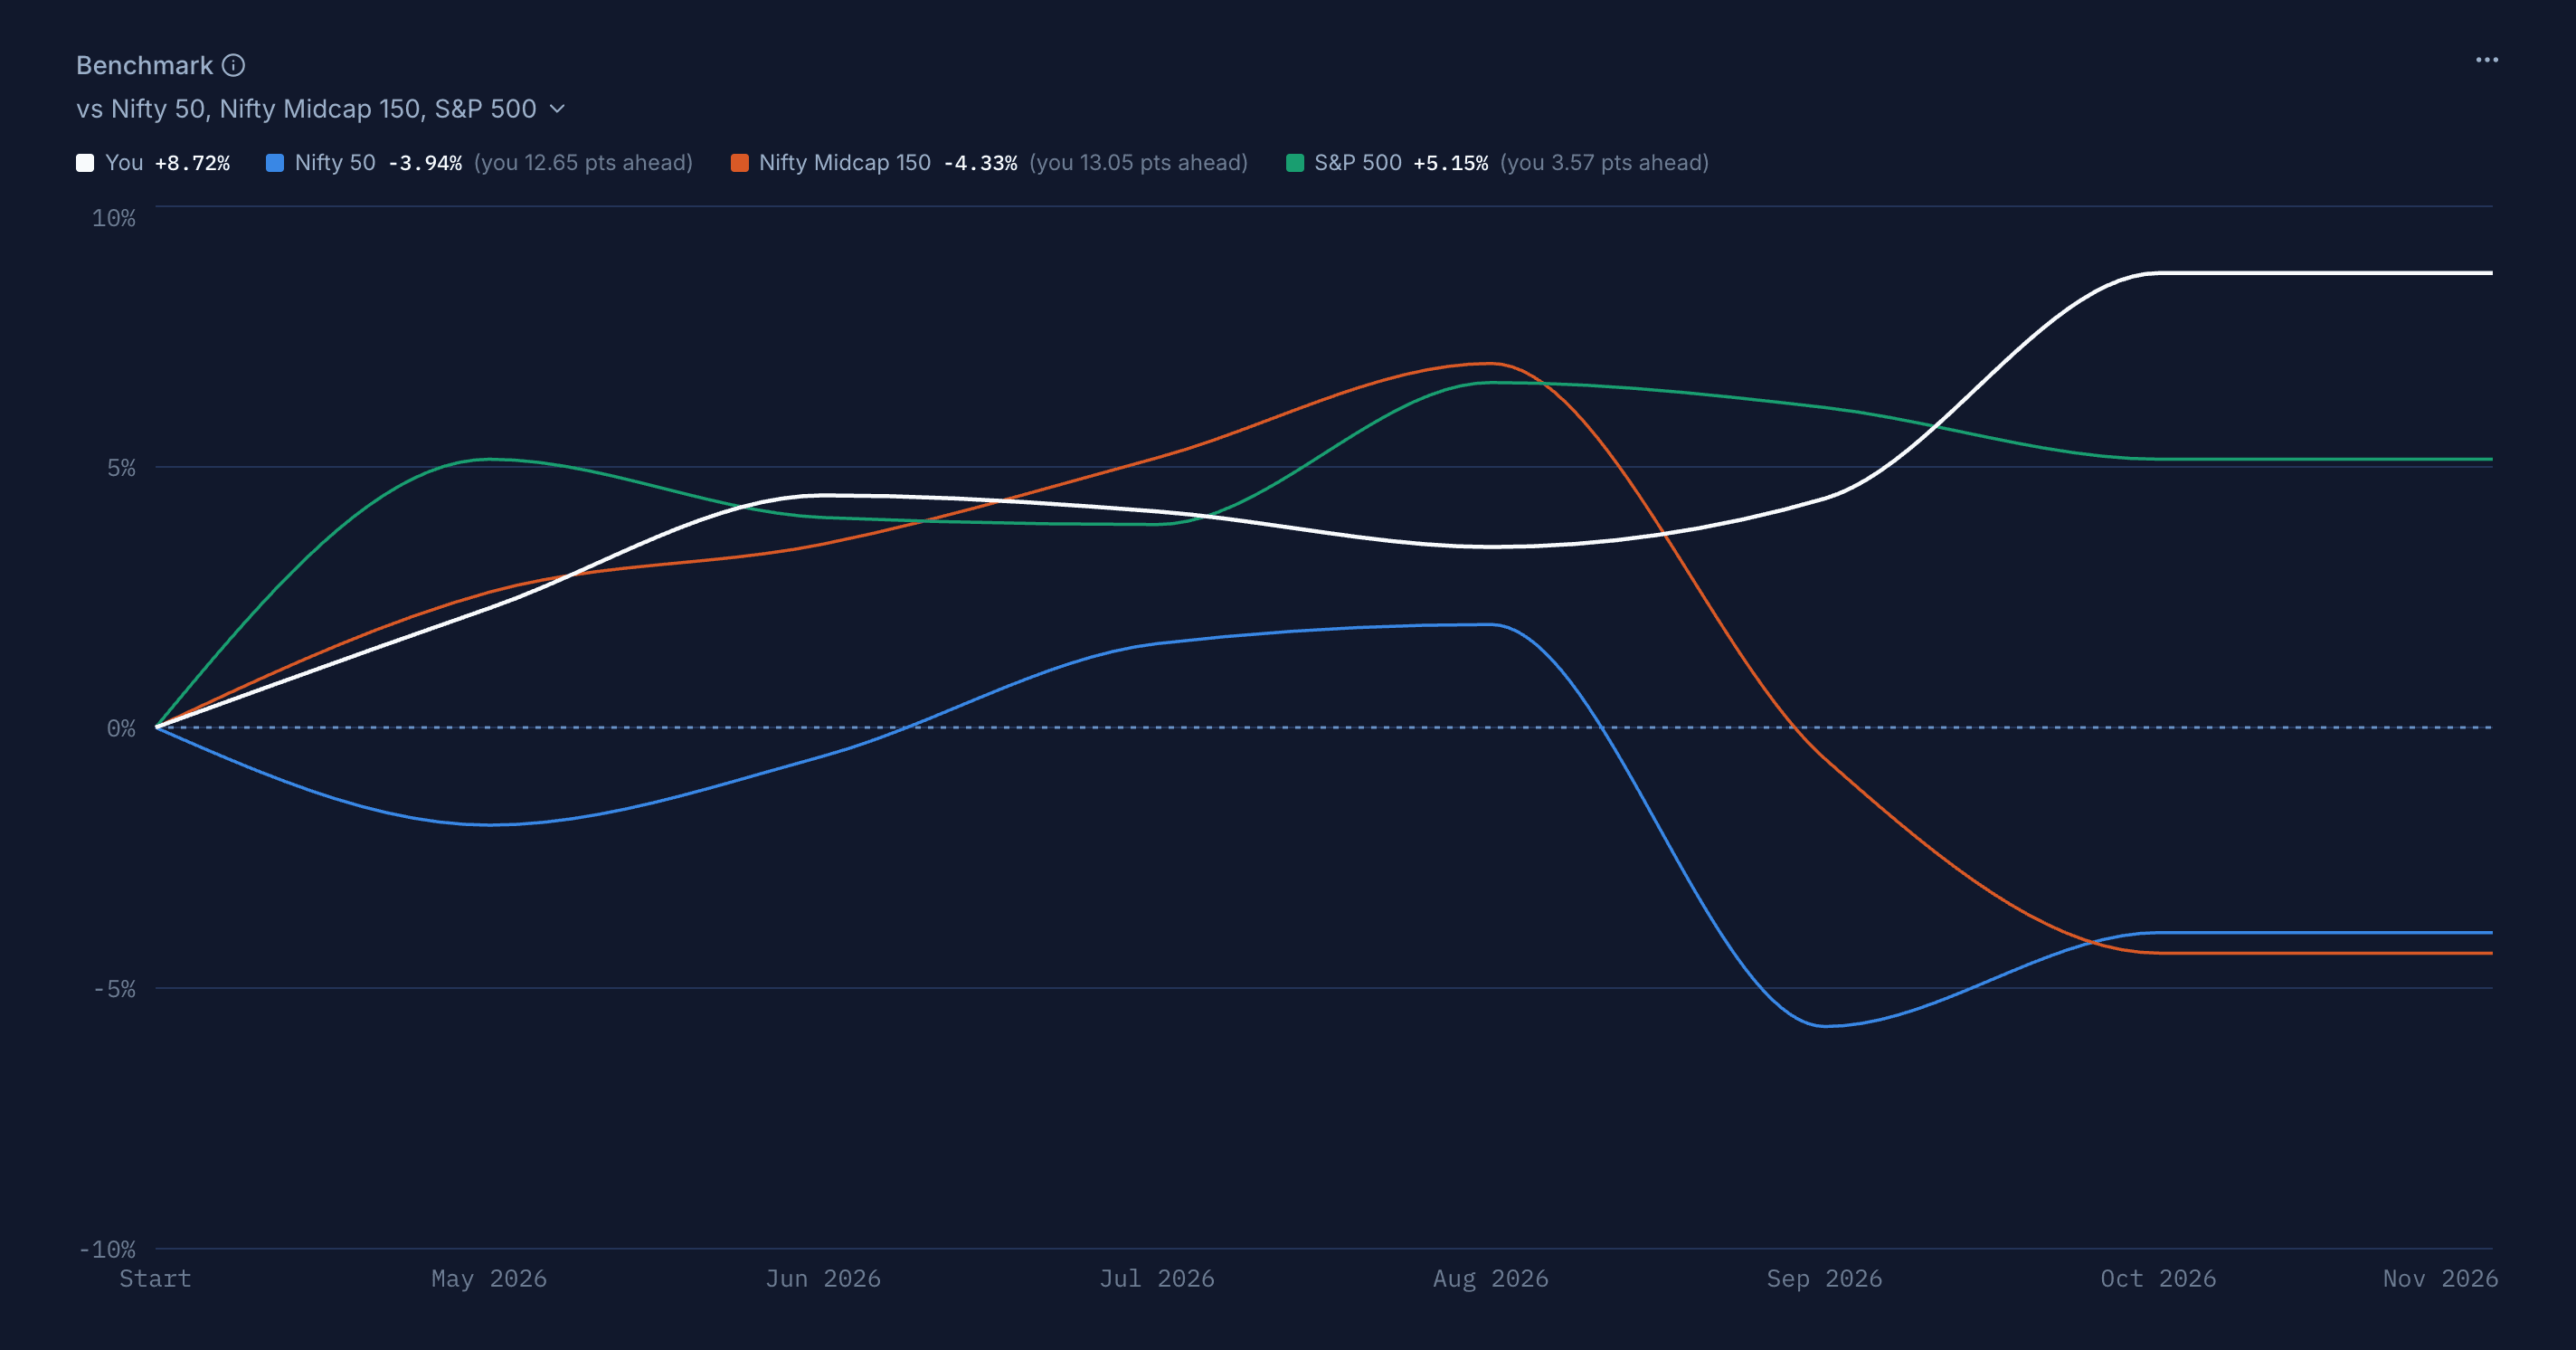
Benchmark: did you beat the index?
A new dashboard widget that plots your return against Nifty 50, S&P 500 and six more indices over the same period, net of charges.
Every trader eventually asks the same question: would I have done better just holding the index? Your dashboard now answers it. The new Benchmark widget draws your return and up to three market indices on one chart, over exactly the same period, all starting from 0%.
Add it to your dashboard
- Open your dashboard and choose Add widget, then Benchmark.
- Click the line under the title (vs Nifty 50) to pick the indices. You can compare against up to three at once.
- Set the date range at the top of the dashboard as usual. The widget compares you and the indices over that range.
How to read it
The legend gives the answer at the end of the period, for example You +6.64% and S&P 500 +16.11% (you 9.46 pts behind). The gap is in percentage points: +12% against +8% is 4 pts ahead. Hover anywhere on the chart to see the same figures at that point in time.
A fair comparison
Deposits and withdrawals don't count. Your line is a time-weighted return, the same one the equity curve shows in Return mode. Adding money to your account doesn't make you look better, and taking it out doesn't make you look worse. An index never receives deposits, so this is the only way the two can be compared.
Always after charges. Brokerage, taxes and fees come off, because that is what you actually kept.
It ignores the Units setting. Whether your dashboard reads in Amount, Return or R, this widget always compares returns, because a return is the only thing an index has.
It needs an opening balance on your broker accounts, since a return has to be measured against something. If one is missing, the widget tells you where to add it.
More places to find it
Account page. Each broker account now has its own Benchmark chart under the equity curve.
Your profile. Pin the widget from its ⋯ menu to show it in Performance Stats on your public profile. It only ever shows returns, never amounts.
Ask AI. If you've connected an AI assistant to your journal, ask it “did I beat the Nifty this year?” and it will answer with the same numbers.