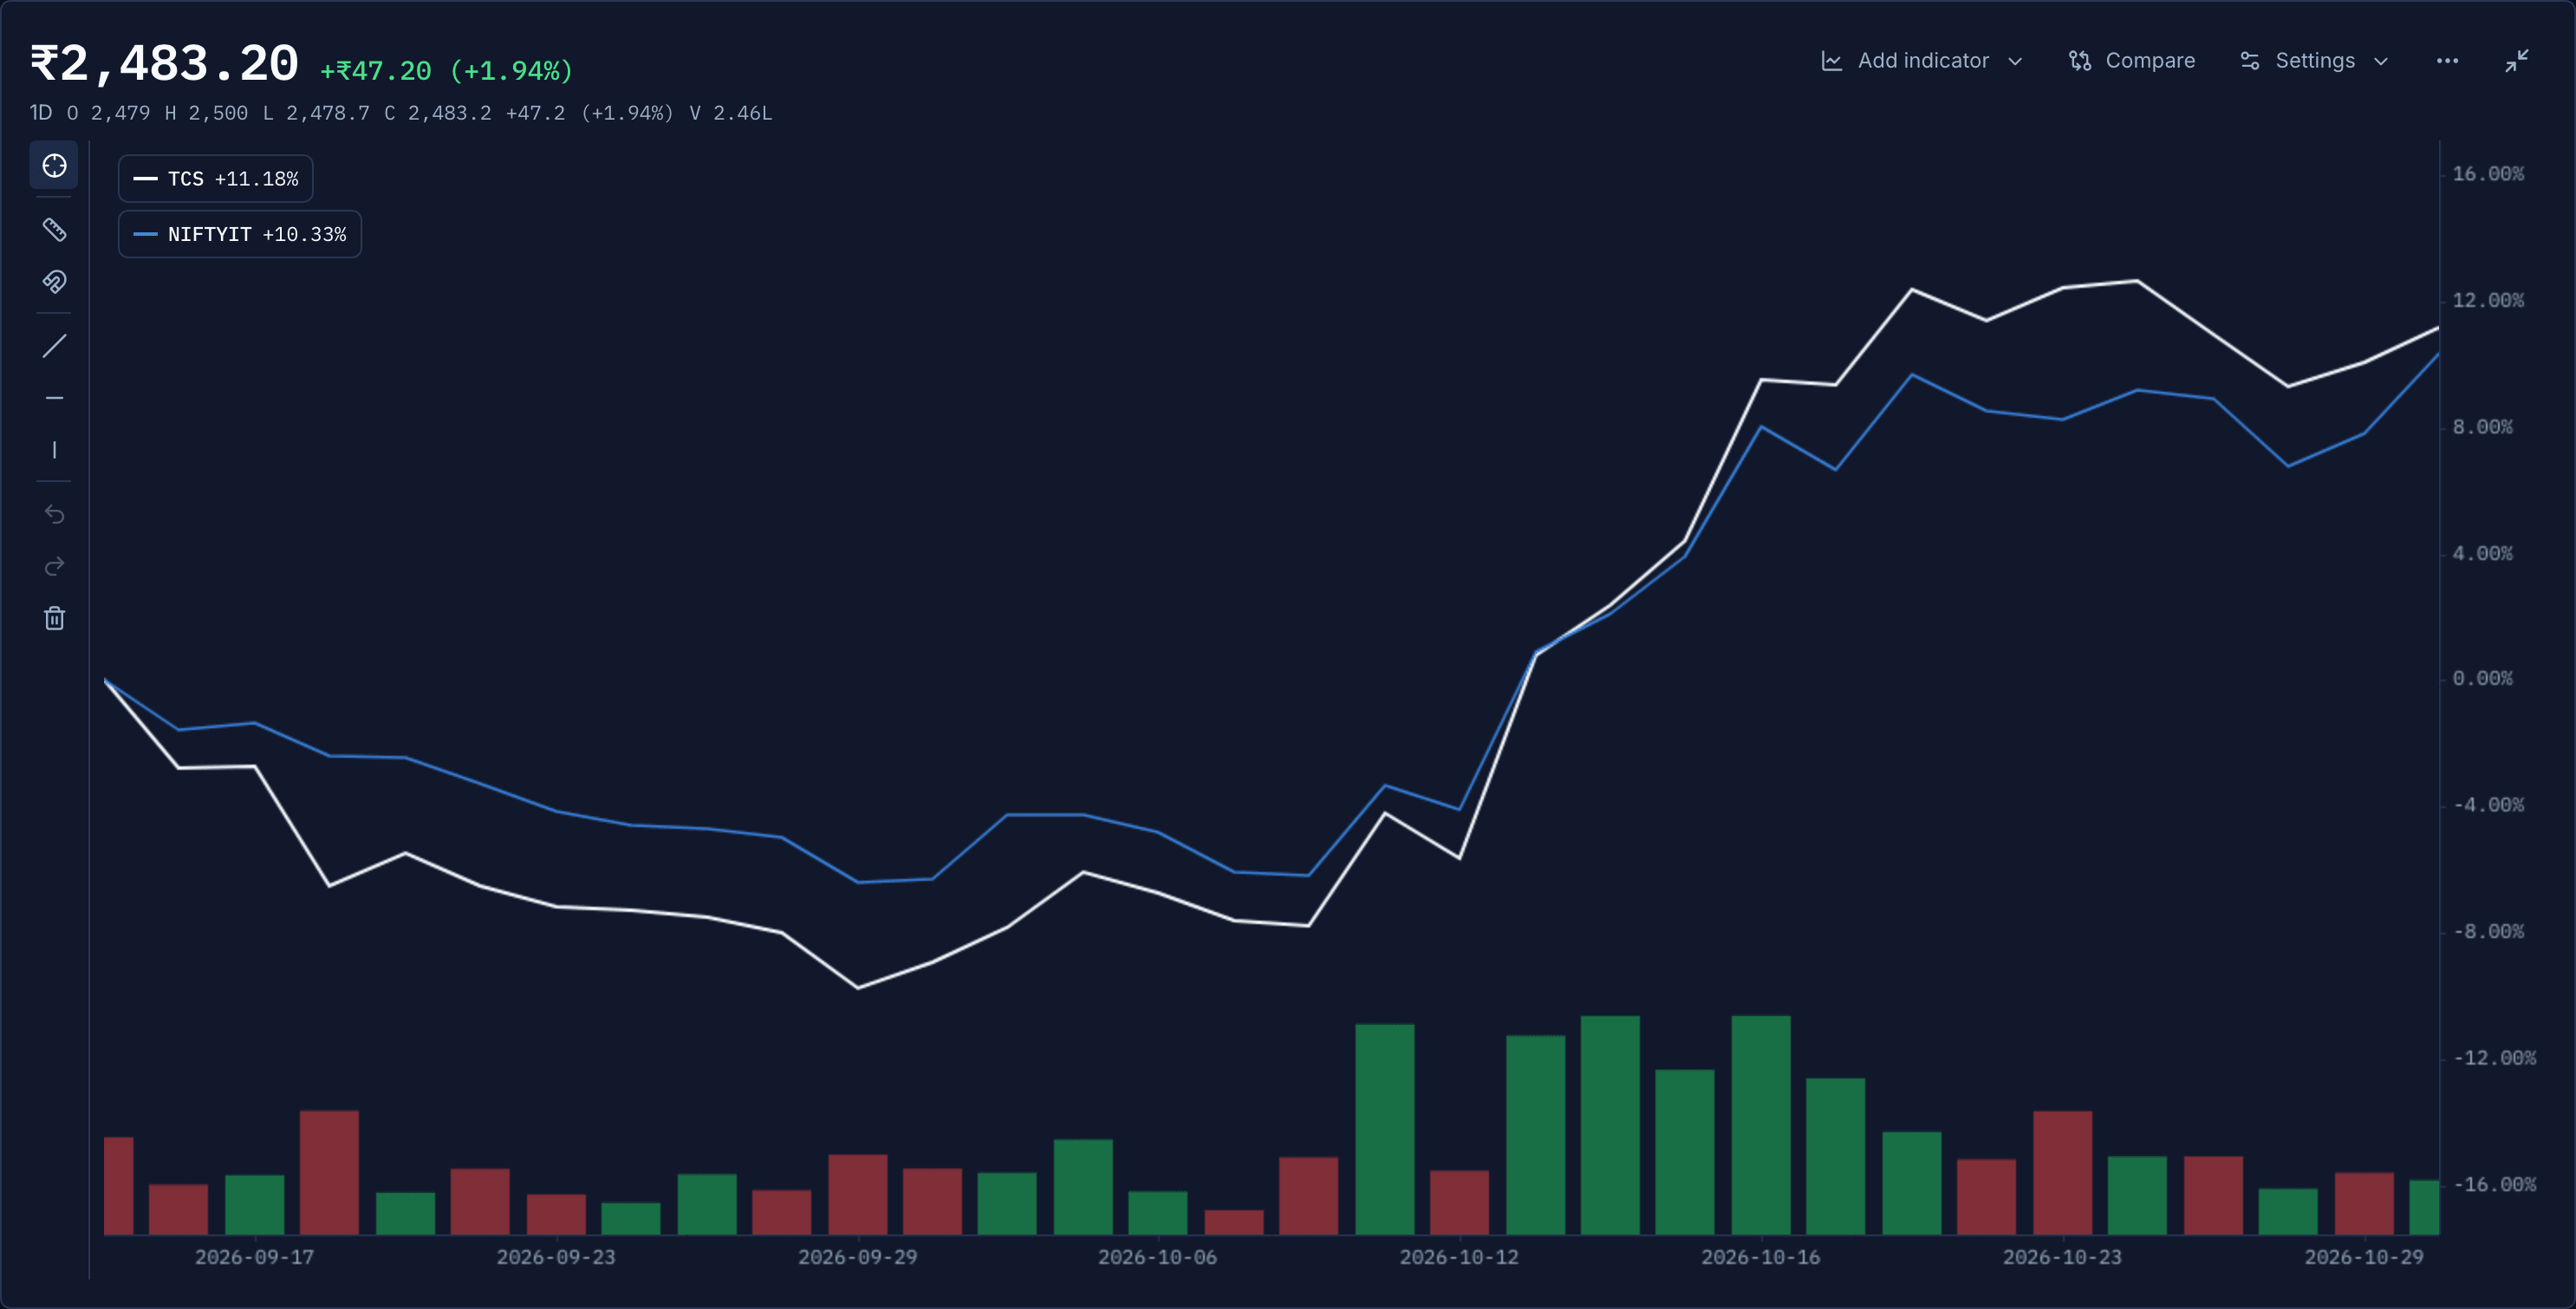
Compare: up to 5 symbols on one chart
Stock vs stock, stock vs sector, index vs index: put up to five symbols on one chart and see who really led over any period you pick.
A stock that rose 11% sounds great until you see its sector rose 10%. The question that matters is usually not “did it go up?” but “did it beat everything around it?” Every symbol chart now answers that. Choose Compare and put up to five stocks or indices on one chart, all starting from 0%.
Any mix works: stock vs stock (HDFC Bank vs ICICI Bank), stock vs its sector (TCS vs Nifty IT), stock vs the market (Reliance vs Nifty 50) or index vs index (Nifty Bank vs Nifty IT). Open an index's chart and compare from there too.
Compare on any chart
- Open any symbol and choose Compare in the chart toolbar.
- Pick from the suggestions, or search any stock or index in the same market. Arthveda suggests the stock's own sector index first.
- Add up to five. Each gets its own line and color.
How to read it
Every line starts at 0% on the first day you can see, so the legend shows each line's return over exactly what is on screen. In the chart above, TCS +11.18% against Nifty IT +10.33%: TCS beat its sector by 0.85 points from 15 September to 30 October.
Zoom to the window you care about. Scroll or zoom until only one month is on screen and the legend reads that month's return for every line. Move the chart and the numbers follow.
While you compare, the stock itself is drawn as a line too, so you are always comparing like with like. Remove the last comparison and the candles come back.
Share what you found
The link keeps the comparison. Copy the page address and whoever opens it sees the same lines.
Save it as an image. The chart's ⋯ menu has Save image and Copy image. The picture carries the dates on screen and every line's return, so it explains itself wherever you post it.
Also new on the chart
Expand. The button at the top right of the chart gives it the whole screen, and Arthveda remembers your choice as you move between symbols.
A tidier legend. A long list of indicators folds into one line with a single click.
Chart tools are free. Indicators, drawings, saved layouts and Compare now work on every account, free or paid.