Journal
Reports
Reports, now with charts
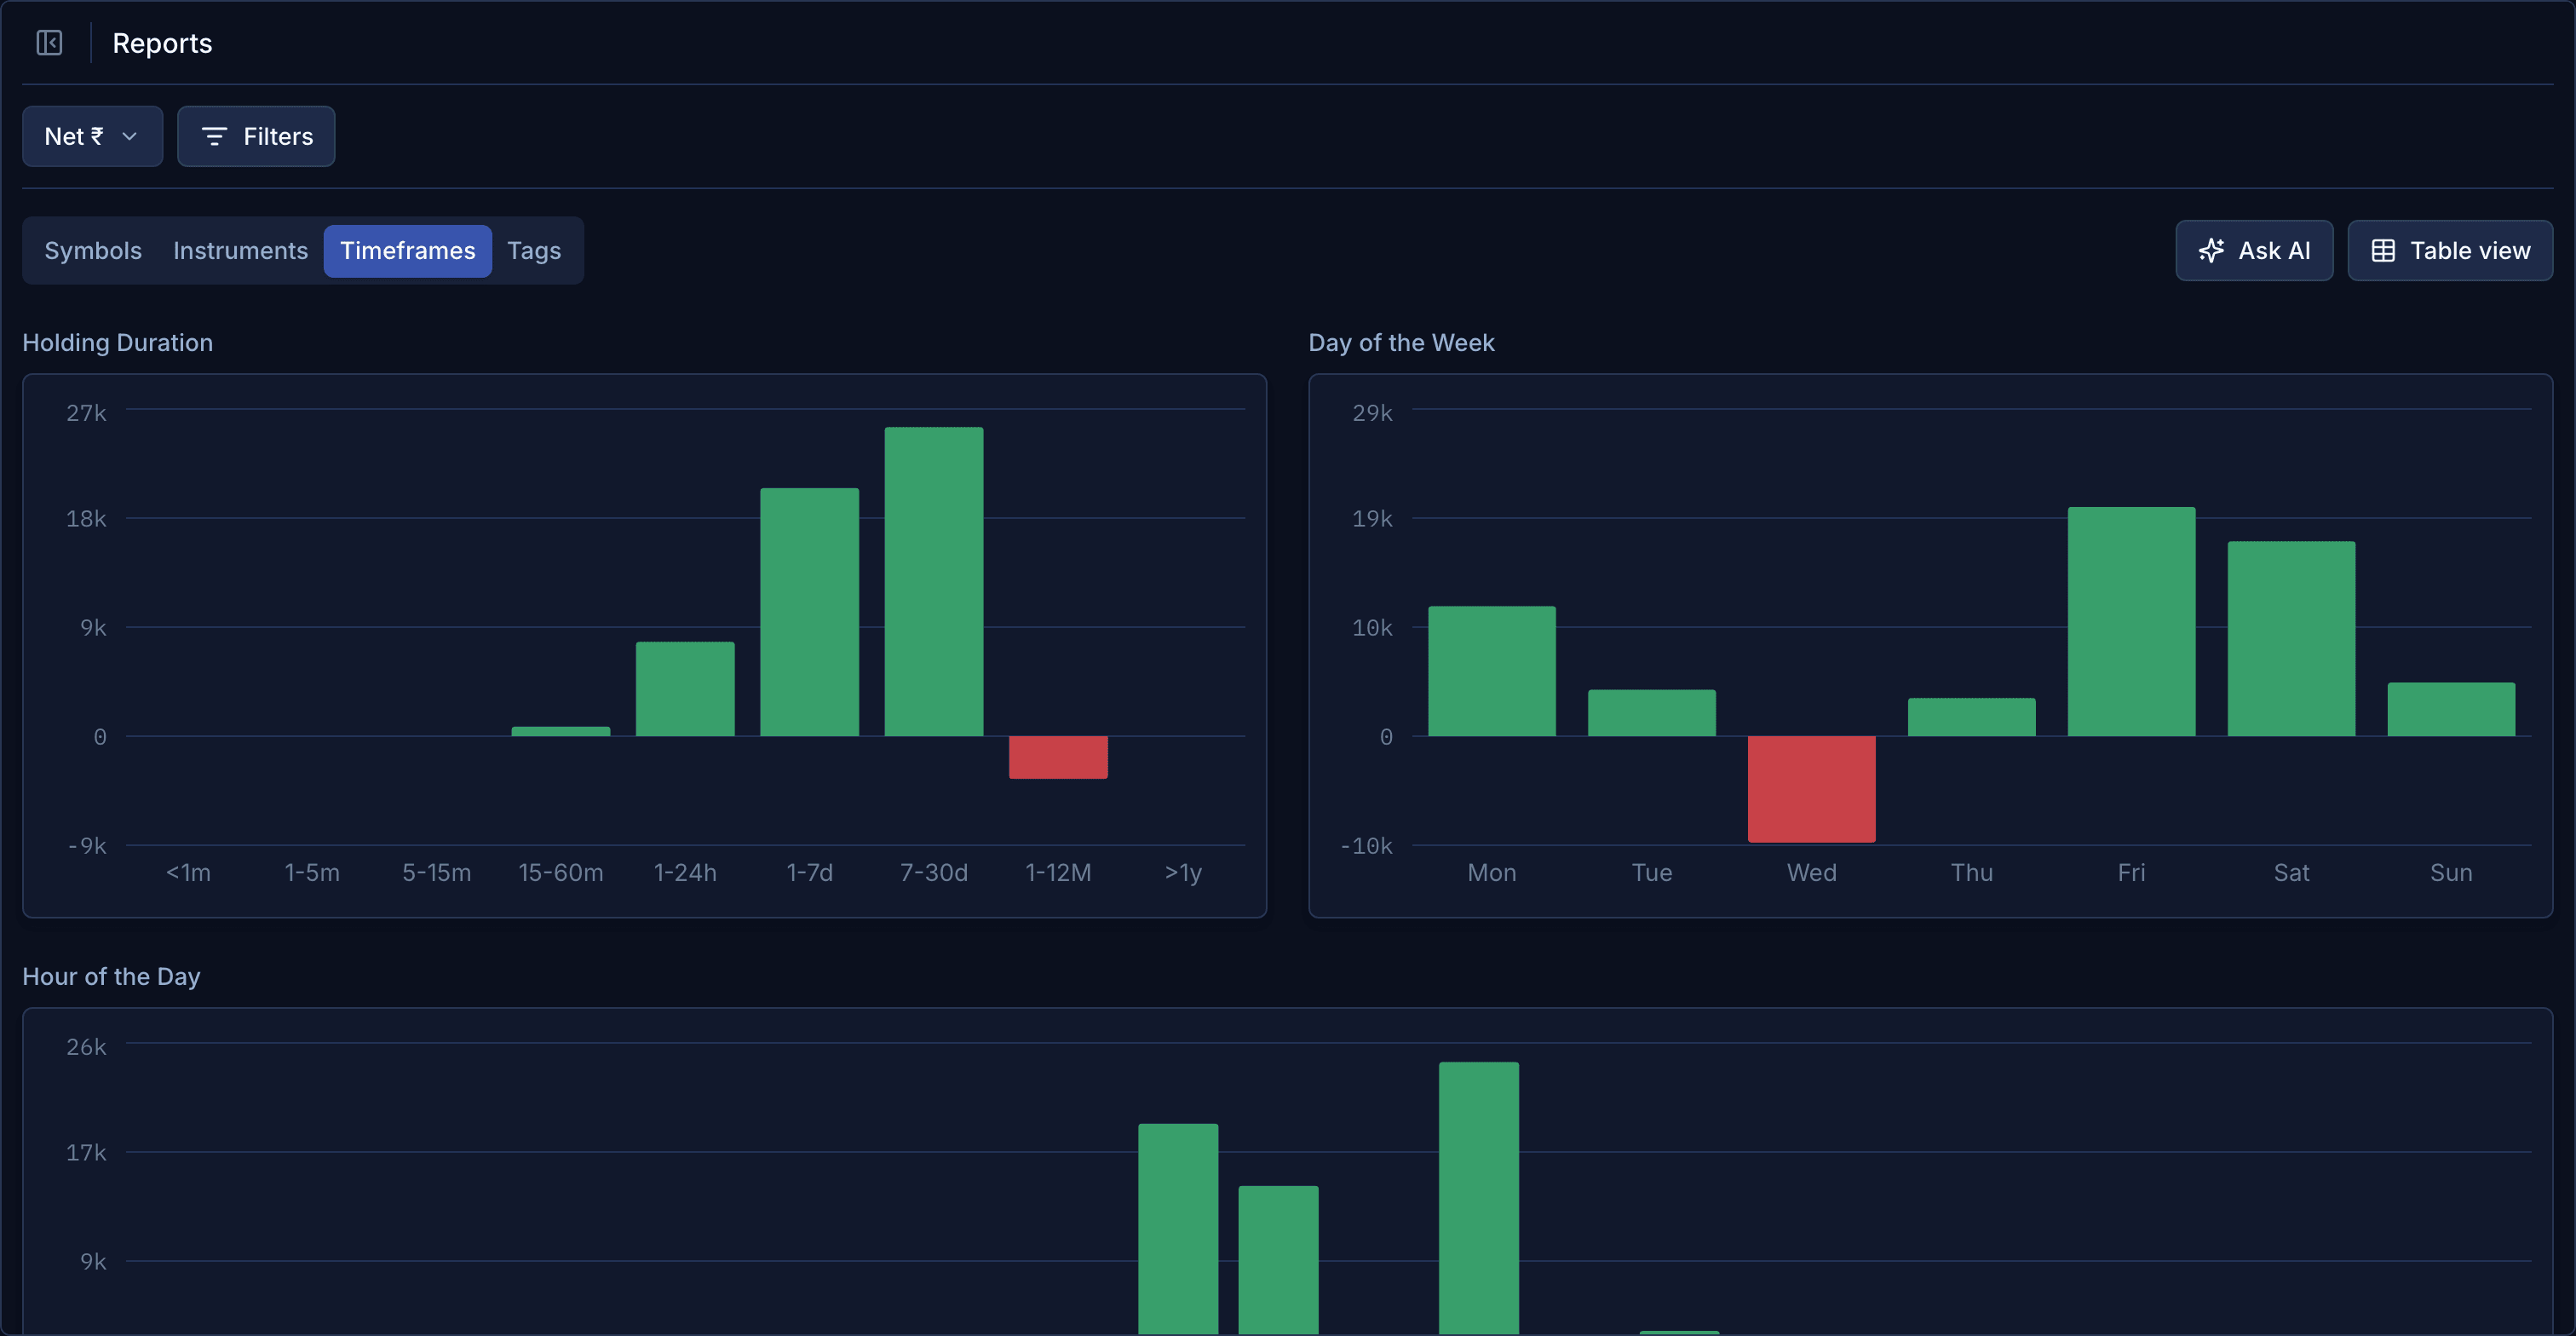
Every Reports tab can show a chart as well as a table, with the same filters as your dashboard and Insights.
Reports were tables. Now every tab can switch between a chart and a table, and they all take the same filters as your dashboard and Insights: account, instrument, tags, dates.
A bar for each weekday or hour makes the pattern obvious in a way a column of numbers never did.
From 1 September 2026, Reports and the dashboard also read in Amount, Percent or R, gross or net of charges.