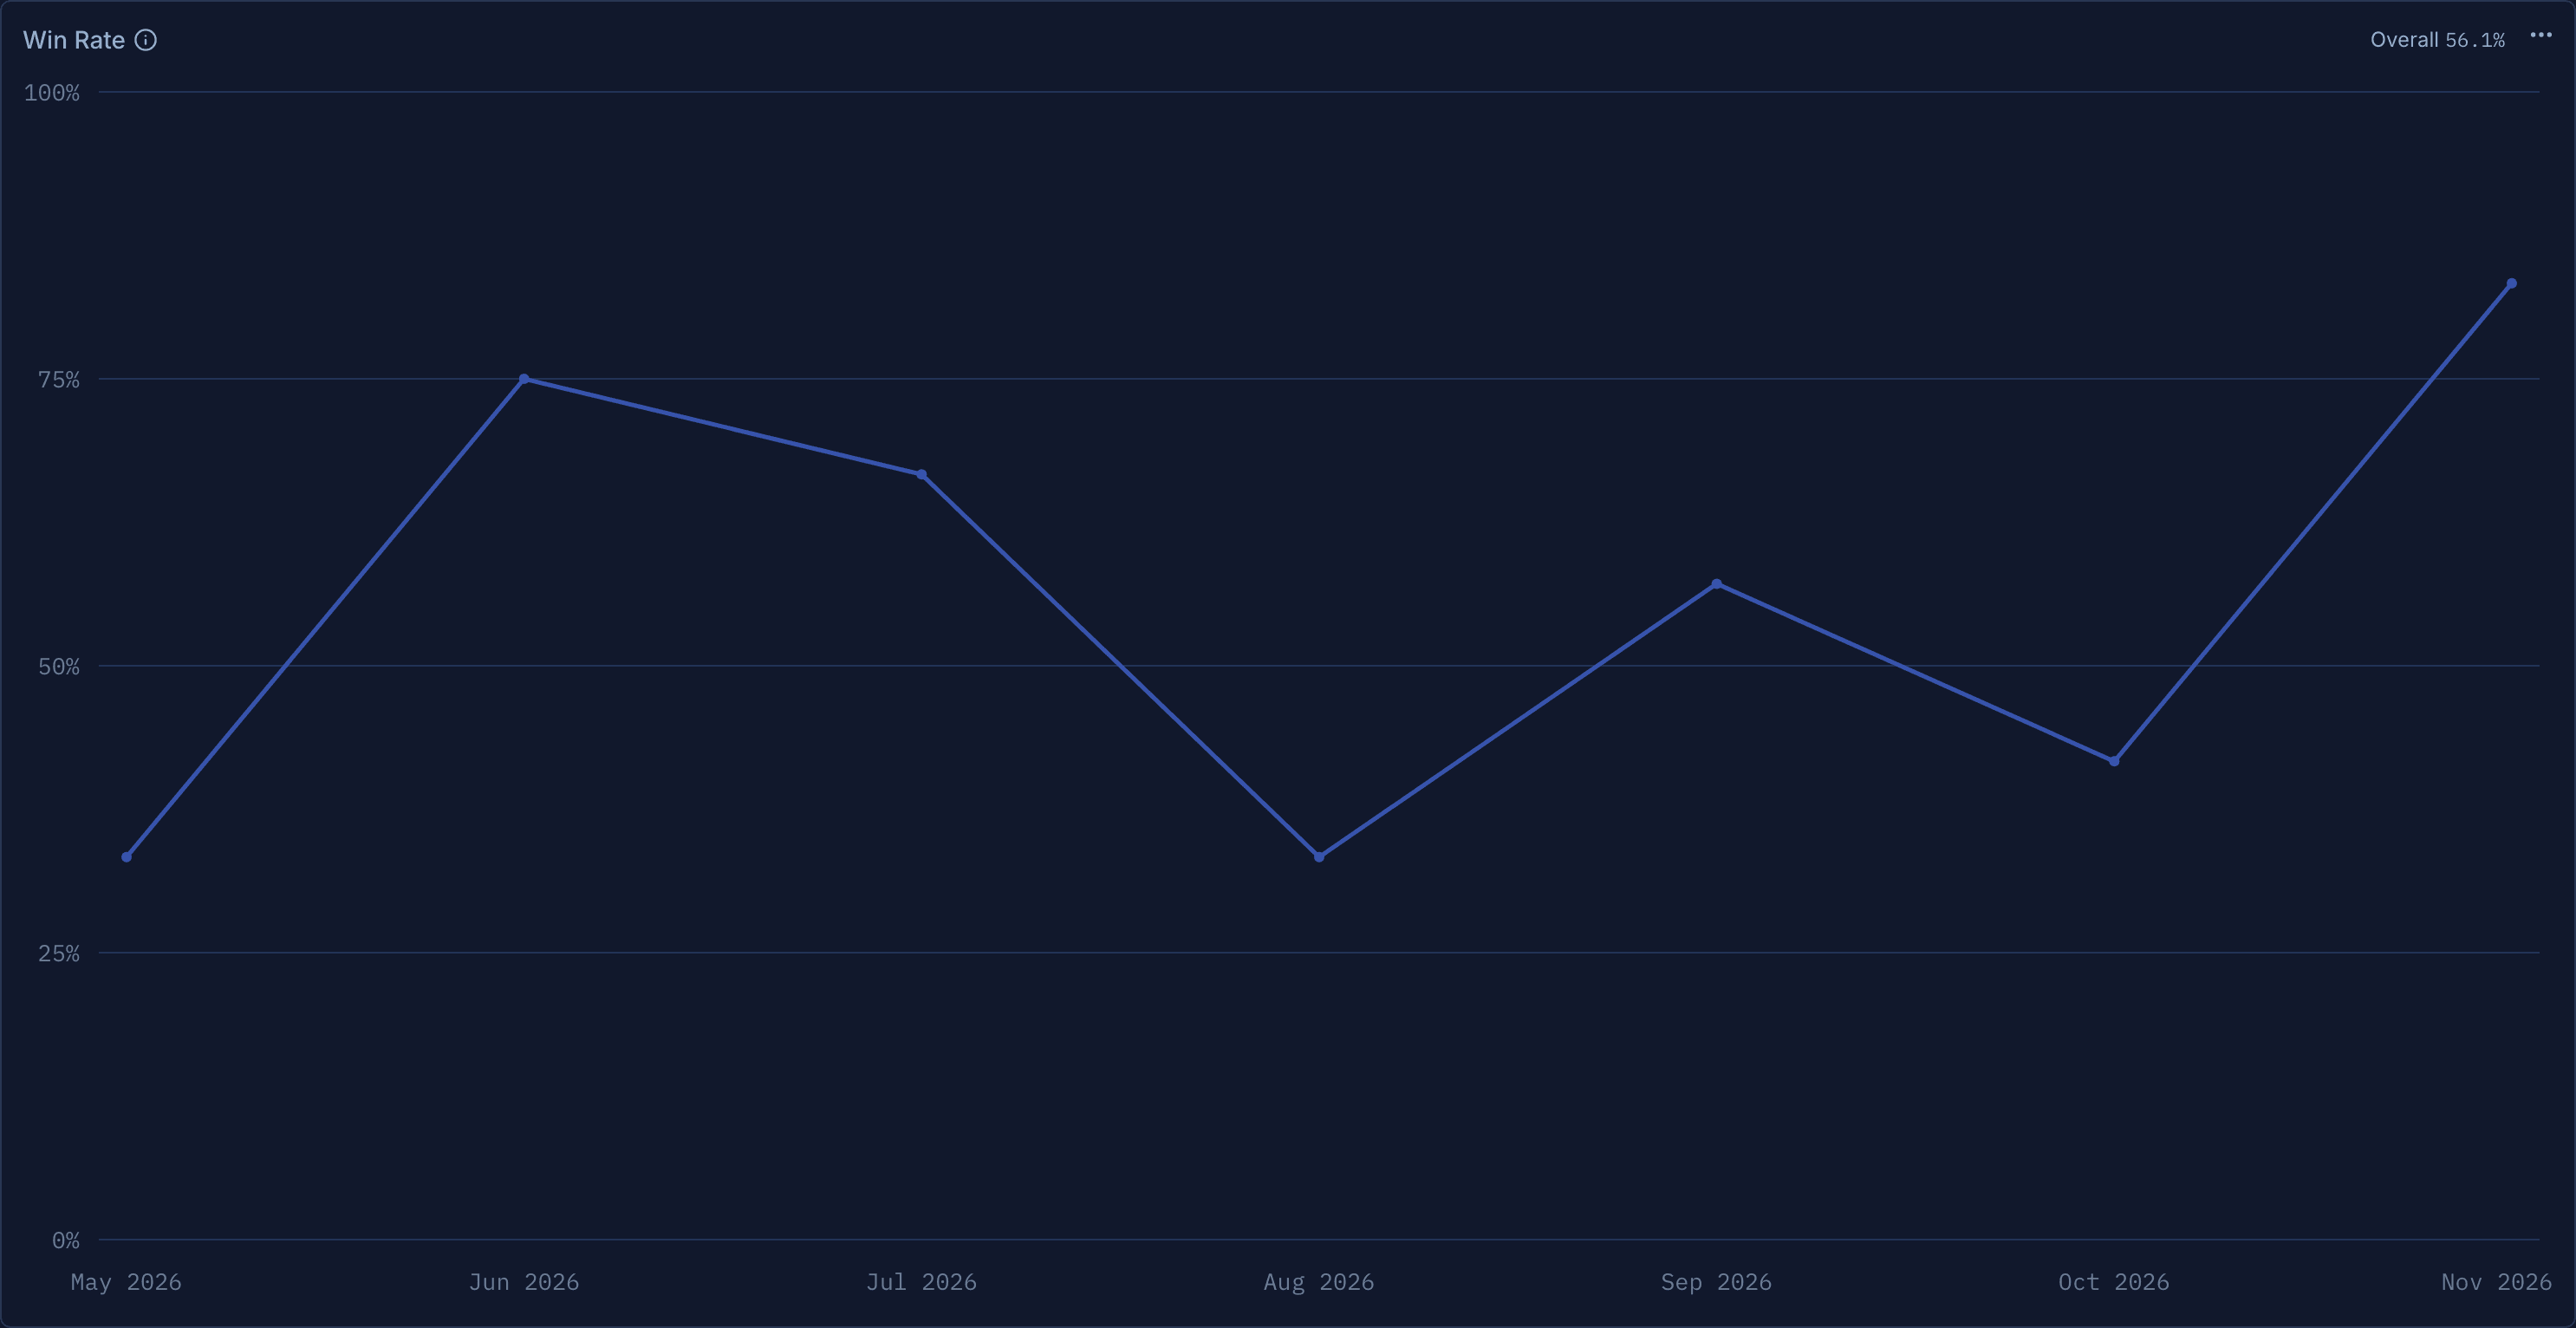
Your stats have a timeline now
Win rate, Expectancy, Profit Factor and Avg Win/Loss can now show period by period as a bar or line chart, not just one number for the range.
A 55% win rate looks the same whether you held it all year or slid from 70% to 40%. Only one of those needs your attention. Until now, the dashboard showed you a single number for the whole range. Now Win rate, Expectancy, Profit Factor and Avg Win / Loss can show that number period by period, as a bar or a line chart.
Switch a widget to a chart
- Open your dashboard and click the ⋯ menu on any of the four widgets.
- Under View, pick Bar chart or Line chart. The tile grows to fit the chart.
- Pick Value to go back. The tile returns to the size it had.
The choice is saved with your dashboard view, so it is there the next time you open it. Resize or move the tile from Edit layout as usual.
How to read it
Each bar or point is one period. The period follows the date range you set at the top of the dashboard, the same way the PnL charts do:
Your overall number stays in view at the top right of the widget, so you can tell at a glance which periods beat your average and which are worth a closer look.
A trade counts in the period it closed. Each trade is one win or one loss, decided by its final P&L, so a trade you scaled out of over two months belongs to the month you closed it.
Hover any period to see its value and how many trades it holds. A 100% month from a single trade is easy to spot.
An empty month is not a zero
A month with no closed trades has no win rate, so it shows as n/a instead of 0%. The same goes for Profit Factor and Avg Win / Loss in a period with no losing trades: there is nothing to divide by. Hover the gap and it tells you why.
On the line chart, a faint dashed line bridges those gaps so the trend stays readable. A real 0%, a month where every trade lost, is still a solid point on the axis. The single-number view now says n/a the same way when your range has nothing to measure.
Works with everything else
Units and Gross / Net. Each period follows the dashboard's settings. Expectancy reads in amount, return or R, and Gross switches every period to P&L before charges.
Your profile. Pin a widget in its chart view from the ⋯ menu to show it in Performance Stats on your public profile. It only ever shows rates, ratios and returns, never amounts.
This one was requested by a trader in our Discord. Keep the feature requests coming.